


Crypto RSI heatmap: overbought and oversold coins
The RSI (relative strength index) measures how fast a price has moved on a scale from 0 to 100. The heatmap shows it for many coins at once.
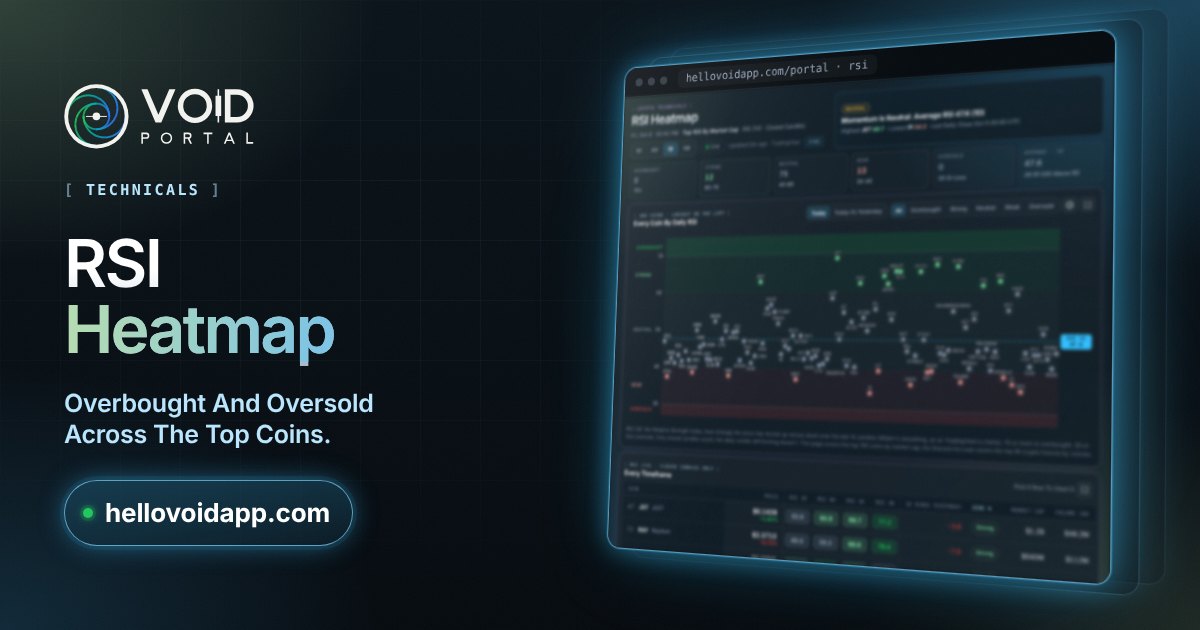
What it shows
- Each coin placed by its RSI.
- The overbought zone, above 70, and the oversold zone, below 30.
- The market's spread, from the most stretched coins to the most beaten down.
How to read it
Above 70 means a coin has risen fast and may pause; below 30, it has fallen fast and may bounce. In a strong trend the RSI can stay stretched for a long time, so read it with the trend.
By coin
Bitcoin (BTC)Ethereum (ETH)BNB (BNB)XRP (XRP)Solana (SOL)TRON (TRX)Hyperliquid (HYPE)Zcash (ZEC)Dogecoin (DOGE)Monero (XMR)Chainlink (LINK)Cardano (ADA)UNUS SED LEO (LEO)Stellar (XLM)NEAR Protocol (NEAR)Bitcoin Cash (BCH)Litecoin (LTC)Canton Coin (CC)Uniswap (UNI)Avalanche (AVAX)
Related
- Crypto technical analysis: trend, momentum and on-chain readings
- Crypto 200-day moving average: every coin against its trend
- Crypto prices, moves and charts
The Portal is free: open it as a guest, no account needed. Market data for information only, not financial advice.