


Crypto prices, moves and charts
Crypto prices lists the largest coins by market value with their moves over several timeframes, and opens a candle chart for any of them.
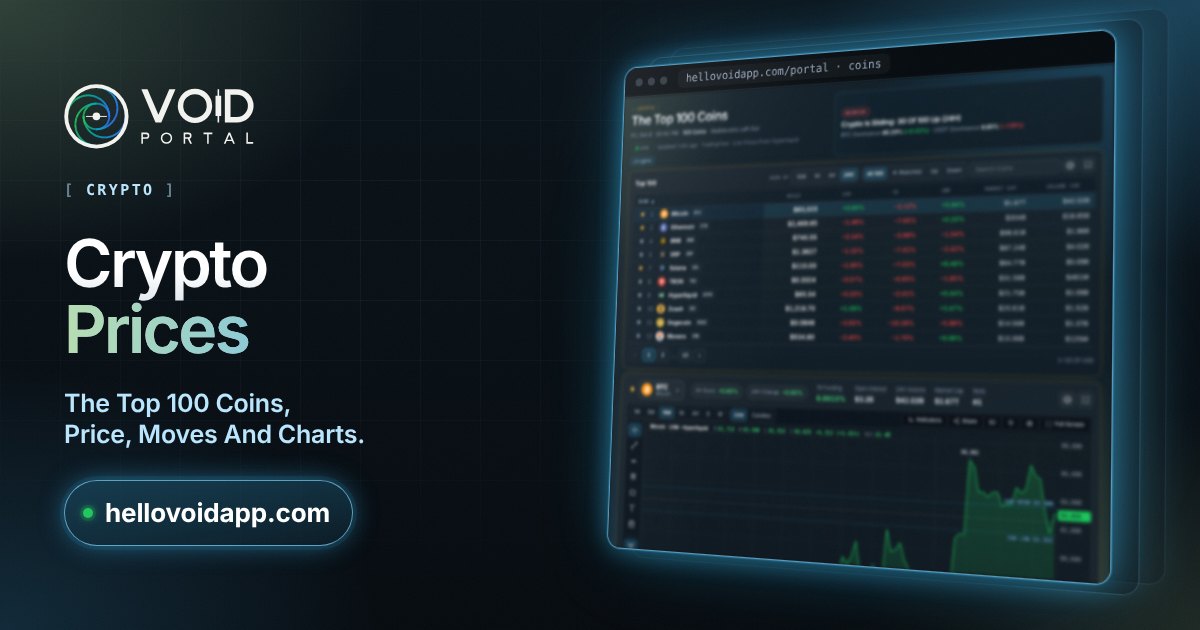
What it shows
- Each coin's live price and market value.
- Its moves over 15 minutes, 1 hour, 4 hours and 24 hours.
- A candle chart, green for up and red for down, on the timeframe you pick.
- A page of its own for each coin, with its funding, liquidations and technicals.
How to read it
Short moves show what is happening now; the 24-hour move shows the day. A coin moving with the market tells you less than one moving against it.
By coin
Bitcoin (BTC)Ethereum (ETH)BNB (BNB)XRP (XRP)Solana (SOL)TRON (TRX)Hyperliquid (HYPE)Zcash (ZEC)Dogecoin (DOGE)Monero (XMR)Chainlink (LINK)Cardano (ADA)UNUS SED LEO (LEO)Stellar (XLM)NEAR Protocol (NEAR)Bitcoin Cash (BCH)Litecoin (LTC)Canton Coin (CC)Uniswap (UNI)Avalanche (AVAX)
Related
- Crypto market overview: prices, Fear & Greed and dominance
- Crypto technical analysis: trend, momentum and on-chain readings
- Crypto RSI heatmap: overbought and oversold coins
The Portal is free: open it as a guest, no account needed. Market data for information only, not financial advice.