


Crypto 200-day moving average: every coin against its trend
The 200-day moving average is the most watched line for a long-term trend. This view shows how far each coin sits above or below its own.
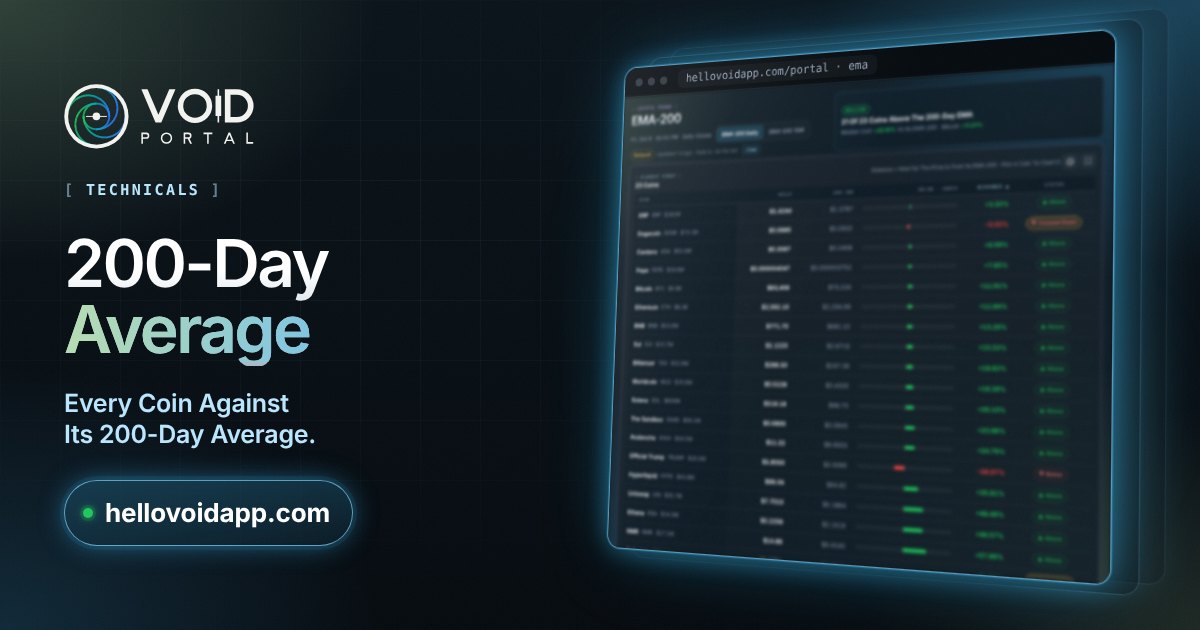
What it shows
- Each coin's distance from its 200-day average.
- Which coins are above it and which are below.
- A year of daily candles with the average drawn on it, for each coin.
How to read it
Above the 200-day average is usually read as a long-term uptrend, below it as a downtrend. A coin crossing it, either way, is a change many traders act on.
Related
- Crypto technical analysis: trend, momentum and on-chain readings
- Crypto RSI heatmap: overbought and oversold coins
- Crypto prices, moves and charts
The Portal is free: open it as a guest, no account needed. Market data for information only, not financial advice.