


Crypto liquidations and the liquidation heatmap
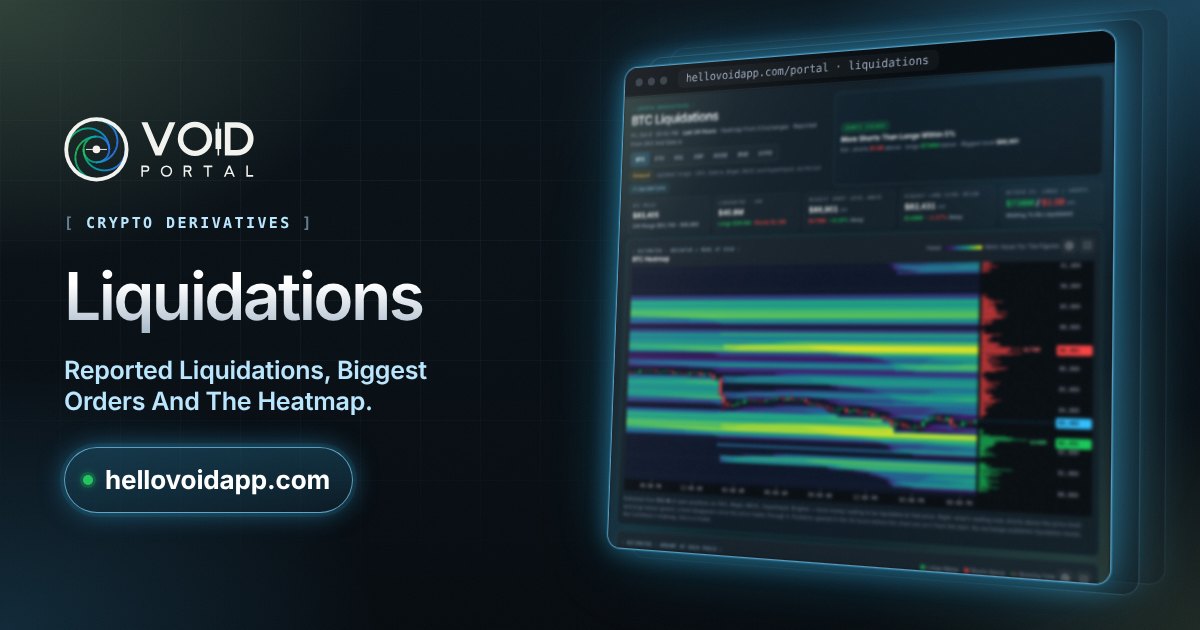
When a leveraged trader runs out of margin, the exchange closes the position for them: a liquidation. This view shows the ones exchanges report and where more are likely to sit.
What it shows
- Reported liquidations from OKX and Gate, long and short.
- The biggest liquidation orders as they happen.
- A liquidation heatmap: the price levels where leveraged positions would be forced to close.
How to read it
Bright bands on the heatmap are prices with many positions at risk. Price is often drawn toward them, and a run through one can speed a move up as positions close in a row.
By coin
Bitcoin (BTC)Ethereum (ETH)BNB (BNB)XRP (XRP)Solana (SOL)TRON (TRX)Hyperliquid (HYPE)Zcash (ZEC)Dogecoin (DOGE)Monero (XMR)Chainlink (LINK)Cardano (ADA)UNUS SED LEO (LEO)Stellar (XLM)NEAR Protocol (NEAR)Bitcoin Cash (BCH)Litecoin (LTC)Canton Coin (CC)Uniswap (UNI)Avalanche (AVAX)
Related
- Crypto funding rates across exchanges
- Bitcoin and Ether options: max pain, implied volatility and skew
- Crypto technical analysis: trend, momentum and on-chain readings
The Portal is free: open it as a guest, no account needed. Market data for information only, not financial advice.