


S&P 500 heatmap, sectors, movers and ETFs
US stocks shows how Wall Street is trading, in the same place as crypto, so you can see whether the two are moving together.
What it shows
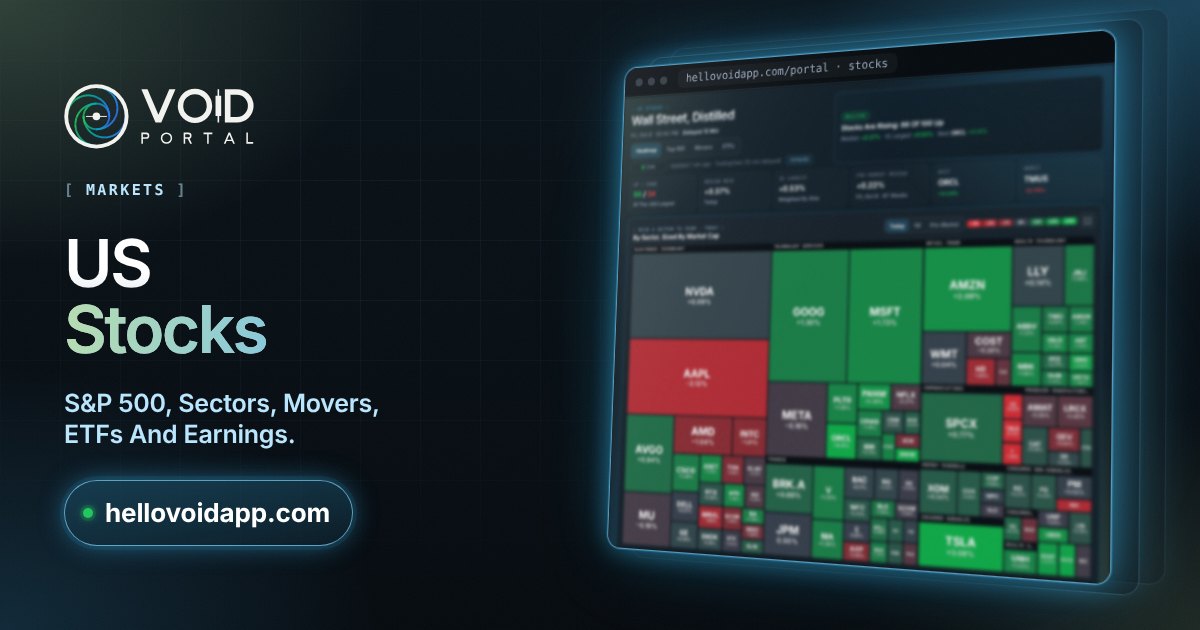
- The S&P 500 as a heatmap, each company sized by its market value.
- Sectors, from technology to energy.
- The day's biggest movers, up and down.
- ETFs and the week's earnings.
How to read it
A heatmap mostly one colour means a broad move; a few large boxes moving alone means a handful of big companies are carrying the index. US stock figures are delayed 15 minutes.
Related
- Stock indices, currencies, commodities and bond yields
- Economic calendar: releases and central bank decisions
- Crypto and market news, with official releases
The Portal is free: open it as a guest, no account needed. Market data for information only, not financial advice.