
Void Portal Clarity
Clarity, indicators by Void

Free indicators for a clearer chart

Trend, momentum, levels, volume, liquidity, zones, structure and risk. Each one keeps the chart clean and tells you in plain words what it sees. Free on TradingView.
Which one do you need?

Each tool draws its own layer on your chart. Point at a name to light its layer, or tap it to jump to the tool.

Example candlestick chart with the Clarity layers drawn together: a trend channel, two key levels, a volume profile, equal highs, a supply zone, a demand zone and a fair value gap, a change of character and a break of structure, a stop and three targets, and a momentum wave underneath.ZonesTrendWeekly openPrior week lowLevelsVolumeCHoCHBOSStructureMomentumEqual highsLiquidity3R2R1REntryStopRisk Example candlestick chart with the Clarity layers drawn together: a trend channel, two key levels, a volume profile, equal highs, a supply zone, a demand zone and a fair value gap, a change of character and a break of structure, a stop and three targets, and a momentum wave underneath.ZonesTrendLevelsVolumeStructureMomentumLiquidity3RStopRisk
Example chart, not live data.
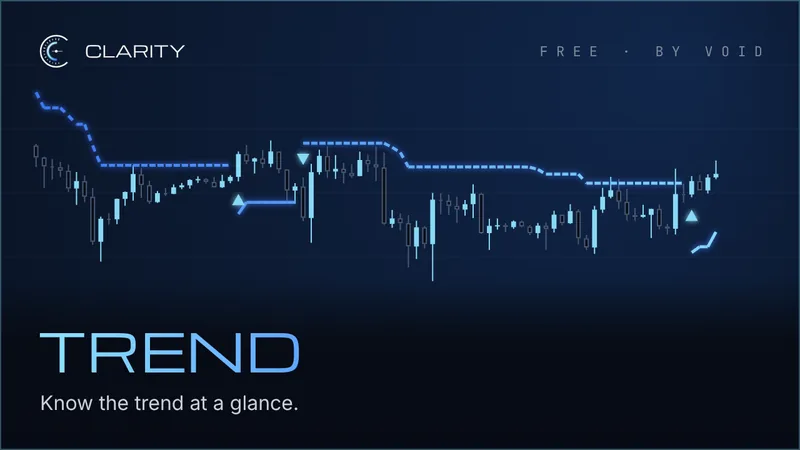
Trend on a candlestick chart: a dashed trend line steps down and up with price, with markers where the side changes.

Direction Start here

Trend: Which side should I be on?

A trend channel and a five-timeframe table that sums it up in one line: trade longs, trade shorts or stand aside.

  • Regression channel
  • Multi-timeframe table
  • EMA ribbon
Open Trend on TradingView (opens in a new tab)
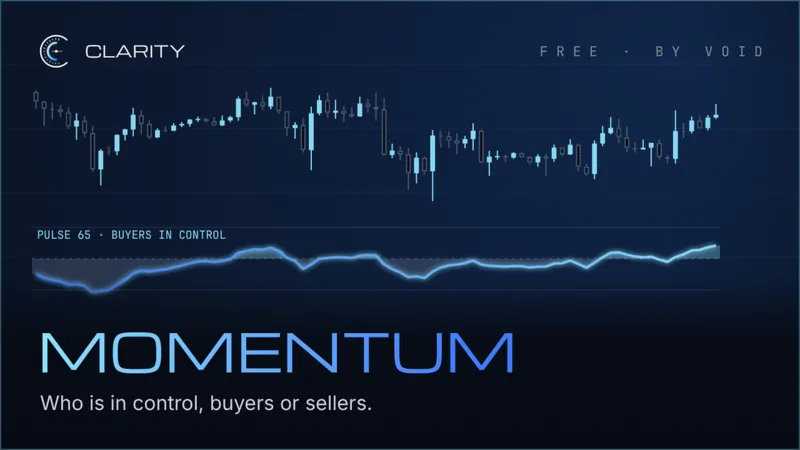
Momentum under a candlestick chart: a pressure panel labelled buyers in control.

Direction

Momentum: Who is in control?

Buyers or sellers, and an early warning when that control is fading.

  • Pressure
  • Divergence
Open Momentum on TradingView (opens in a new tab)
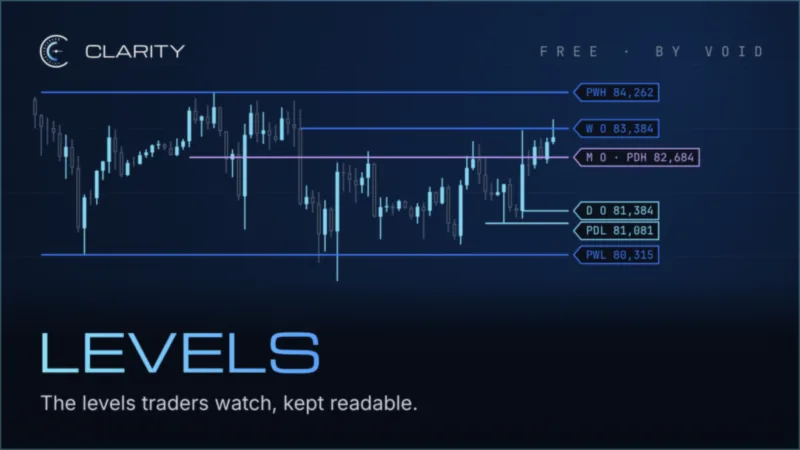
Levels on a candlestick chart: labelled lines for the previous week and day highs and lows and the daily, weekly and monthly opens.

Place

Levels: Which levels matter today?

The higher-timeframe levels traders watch, drawn so they stay readable.

  • Daily and weekly opens
  • Monday range
  • Sessions
Open Levels on TradingView (opens in a new tab)
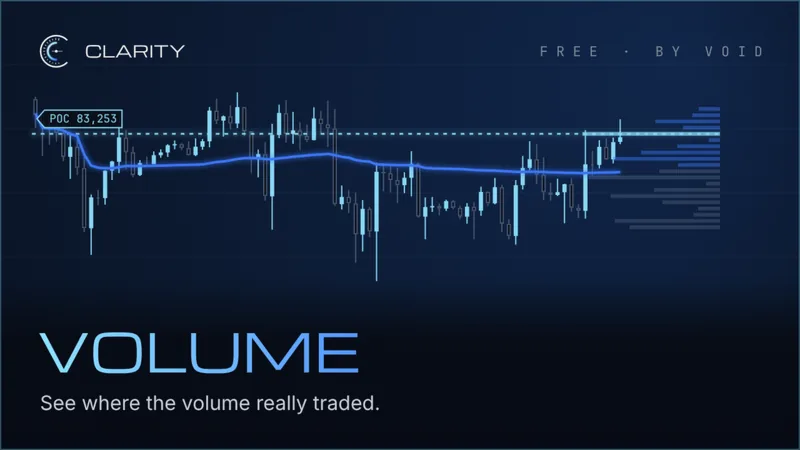
Volume on a candlestick chart: a dashed point-of-control line, a VWAP line running through the candles and a volume profile at the right.

Place

Volume: Where did the volume really trade?

Where volume and liquidity agree, with a plain-English note when price sits on a level that matters.

  • Volume profile
  • Point of control
  • VWAP
Open Volume on TradingView (opens in a new tab)
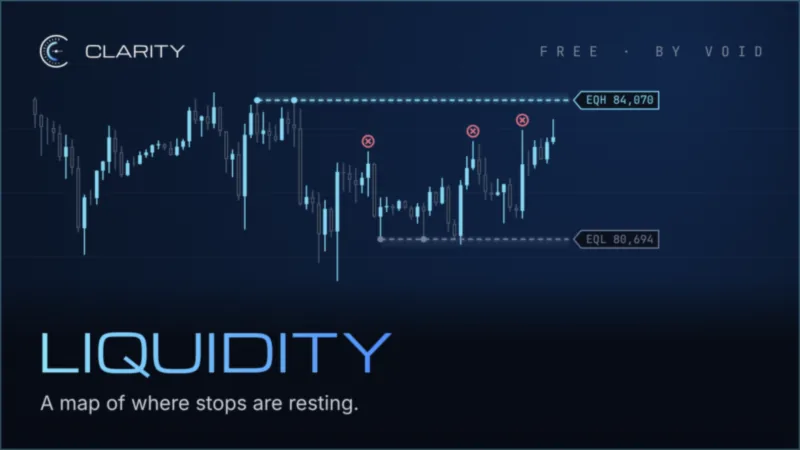
Liquidity on a candlestick chart: a dotted line over equal highs and one under equal lows, with marks where highs were swept.

Place

Liquidity: Where are the stops resting?

A map of where stops are likely resting, above equal highs and below equal lows. A map, not a signal.

  • Equal highs and lows
  • Sweeps
Open Liquidity on TradingView (opens in a new tab)
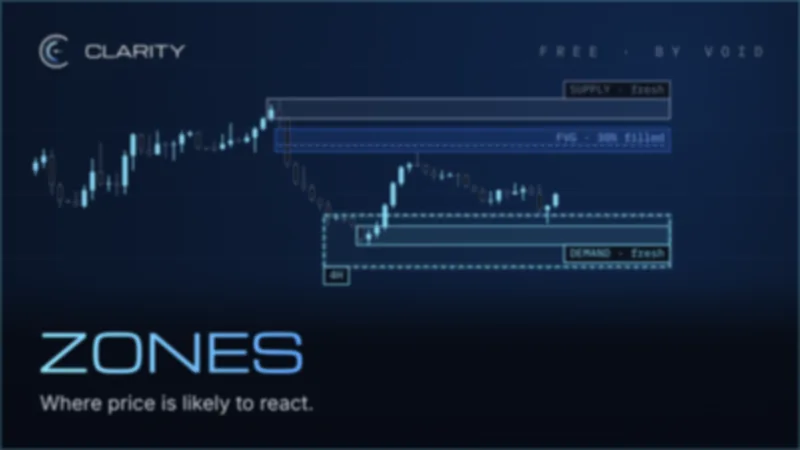
Zones on a candlestick chart: a fresh supply zone at the high where price turned down, a fair value gap below it with its dashed 50% line, 30% filled by a later wick, and a fresh demand zone inside a dashed 4H zone, where price has just wicked in and turned up.

Place

Zones: Where is price likely to react?

Supply and demand zones and fair value gaps, with higher-timeframe zones on top. A map, not a signal.

  • Supply and demand zones
  • Fair value gaps
  • Higher-timeframe zones
Open Zones on TradingView (opens in a new tab)
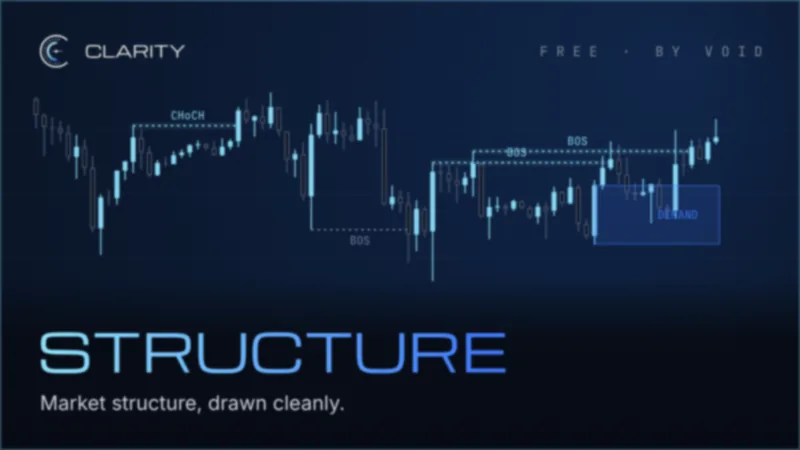
Structure on a candlestick chart: a change of character and breaks of structure marked on the swings, and a demand zone at the right.

Plan

Structure: Where is the entry, and where am I wrong?

Where the trend is, where structure broke, where price may react and where the idea is wrong.

  • Break of structure
  • Change of character
  • Order blocks
  • Fair value gaps
Open Structure on TradingView (opens in a new tab)
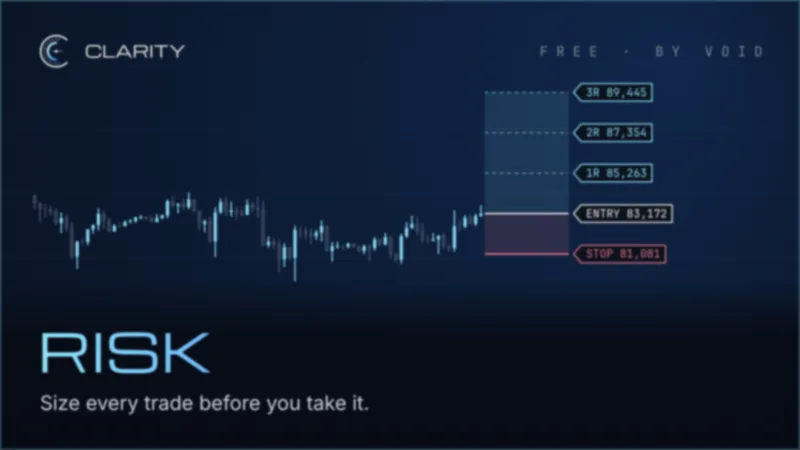
Risk on a candlestick chart: an entry line with the stop below and 1R, 2R and 3R targets stacked above.

Plan

Risk: How big should this trade be?

Plan the trade before you take it: the stop, the targets and the position size.

  • Stop with 1R, 2R and 3R targets
  • Position size
Open Risk on TradingView (opens in a new tab)

Add Clarity to your chart

Each link opens TradingView in a new tab, so this page stays where you left it.

  1. Pick a tool

    Use the Open button with the tool you want, or see them all on TradingView.

  2. Add it to a chart

    On any TradingView chart, open Indicators, search for Clarity and pick yours from the Community results, published by hellojuste. TradingView may ask you to sign in.

  3. Keep it close

    Press the star next to its name in that list, and it waits under Favorites next time.

See them all on TradingView (opens in a new tab)